在 Pipelines UI 中可视化结果
旧版本
此页面是关于 Kubeflow Pipelines V1 的内容,最新信息请参阅 V2 文档。
请注意,虽然 V2 后端能够运行由 V1 SDK 提交的管道,我们强烈建议迁移到 V2 SDK。作为参考,V1 SDK 的最终发布版本是 kfp==1.8.22,其参考文档在此处可用。
此页面展示了如何使用 Kubeflow Pipelines UI 可视化 Kubeflow Pipelines 组件的输出。
简介
Kubeflow Pipelines UI 内置支持多种类型的可视化,您可以使用它们提供丰富的性能评估和比较数据。请按照以下说明将可视化输出数据写入文件系统。您可以在管道执行过程中的任何时候执行此操作。
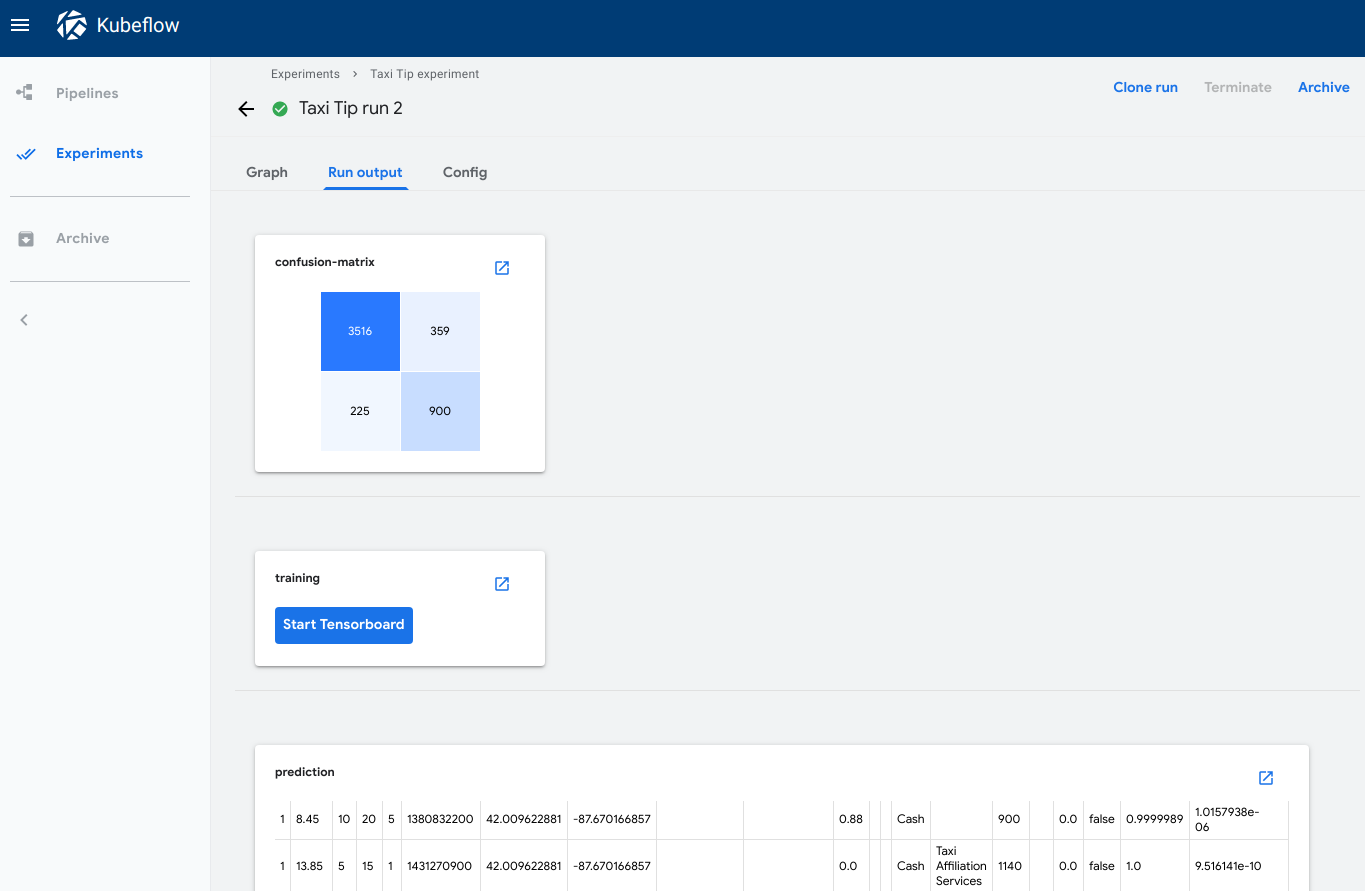
您可以在 Kubeflow Pipelines UI 的以下位置查看输出可视化
运行输出选项卡显示所选运行中所有管道步骤的可视化。要在 Kubeflow Pipelines UI 中打开该选项卡
- 点击实验查看您当前的管道实验。
- 点击您要查看的实验的实验名称。
- 点击您要查看的运行的运行名称。
- 点击运行输出选项卡。
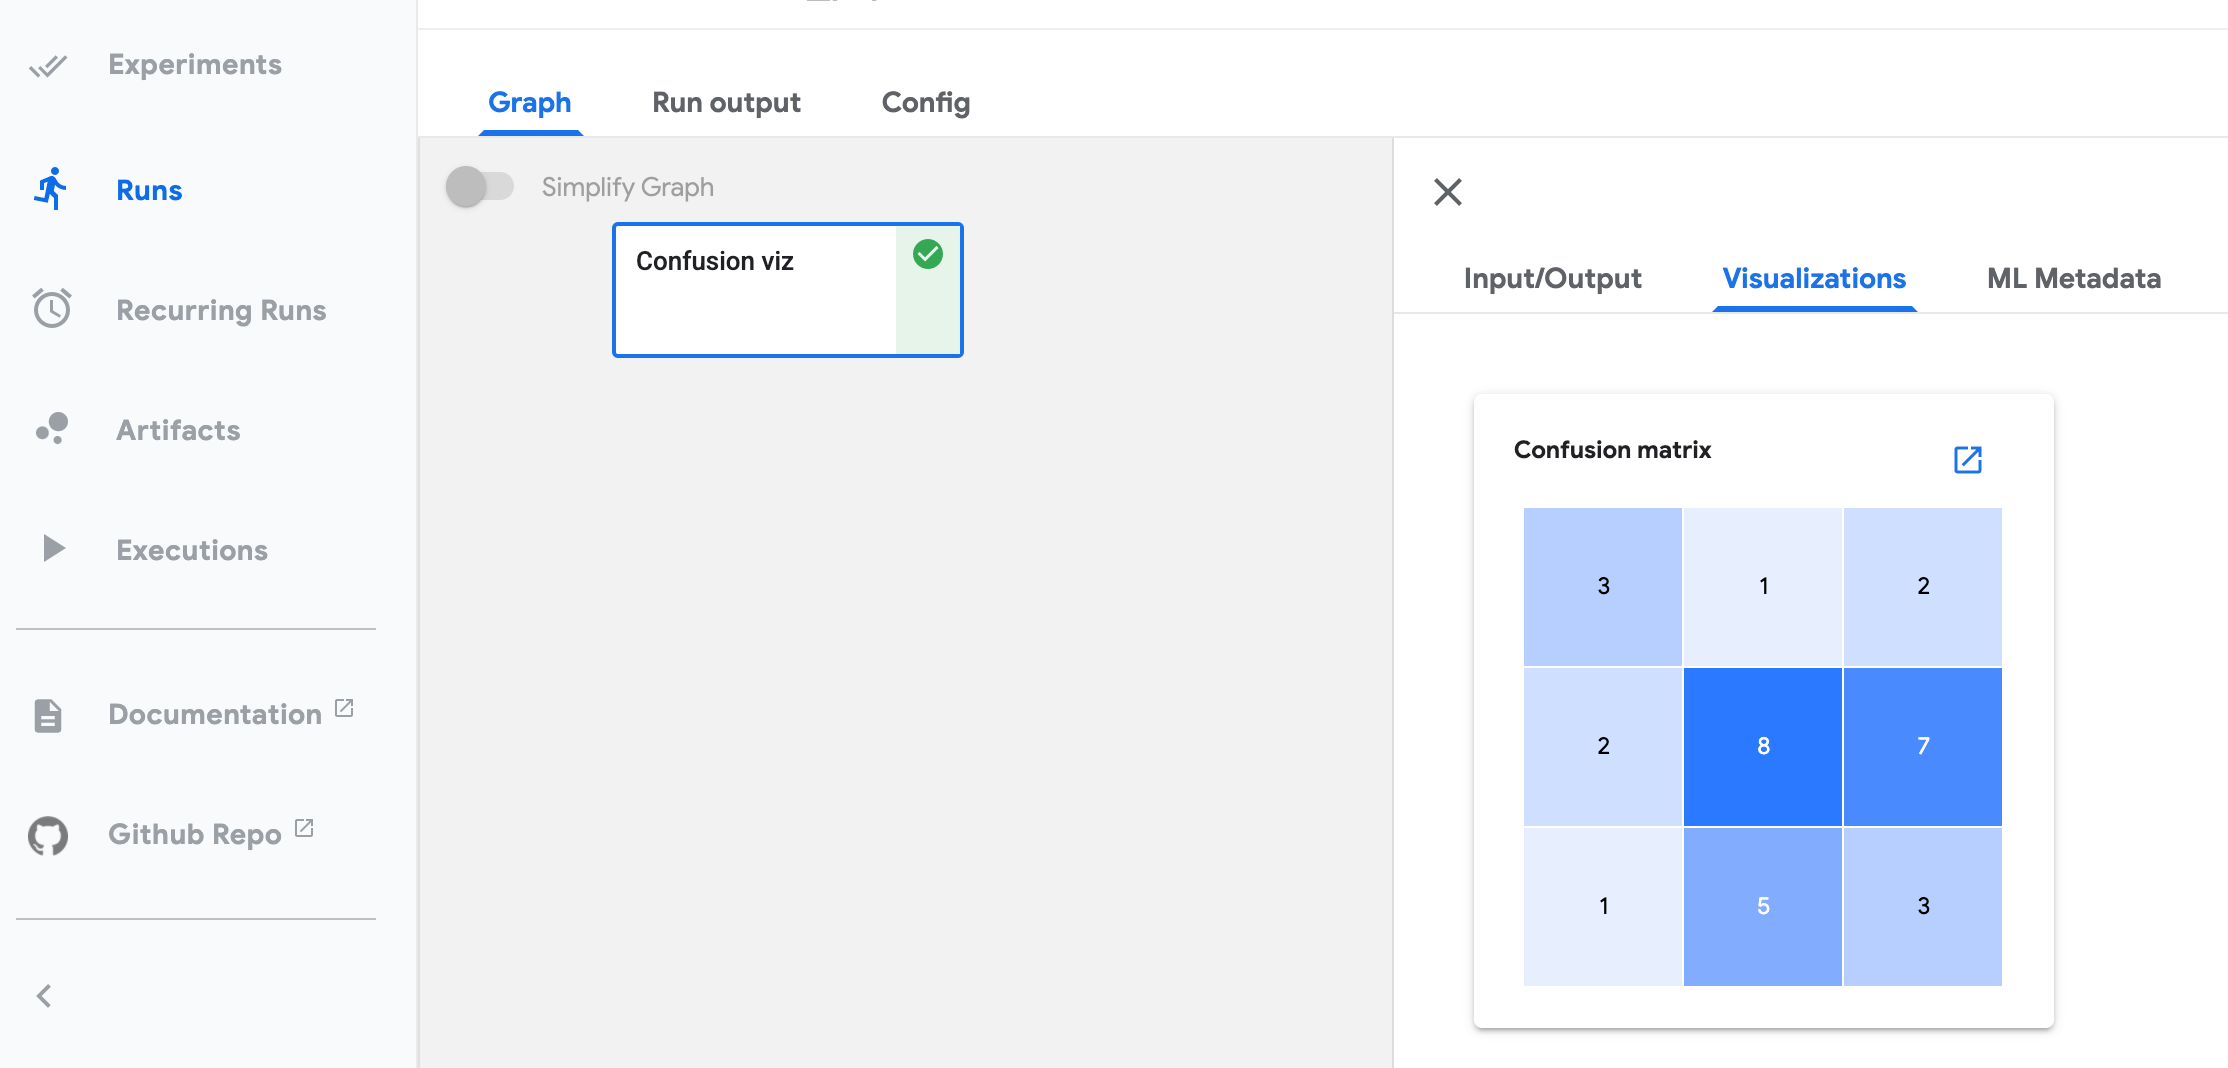
可视化选项卡显示所选管道步骤的可视化。要在 Kubeflow Pipelines UI 中打开该选项卡
- 点击实验查看您当前的管道实验。
- 点击您要查看的实验的实验名称。
- 点击您要查看的运行的运行名称。
- 在图选项卡上,点击代表您要查看的管道组件的步骤。步骤详细信息会滑入视图,显示可视化选项卡。
此页面上的所有截图和代码片段均来自您可以直接从 Kubeflow Pipelines UI 运行的示例管道。请参阅下面的示例描述和链接。
v2 SDK: 使用 SDK 可视化 API
对于 KFP SDK v2 和 v2 兼容模式,您可以使用便捷的 SDK API 和系统 artifact 类型进行指标可视化。当前 KFP 支持 ROC 曲线、混淆矩阵和标量指标格式。所有指标可视化的完整管道示例可在 metrics_visualization_v2.py 中找到。
要求
- 使用 Kubeflow Pipelines v1.7.0 或更高版本:升级 Kubeflow Pipelines。
- 当您编译和运行管道时,使用
kfp.dsl.PipelineExecutionMode.V2_COMPATIBLE模式。 - 确保使用最新的环境 kustomize manifest pipelines/manifests/kustomize/env/dev/kustomization.yaml。
有关每个指标可视化输出的使用指南,请参阅以下部分
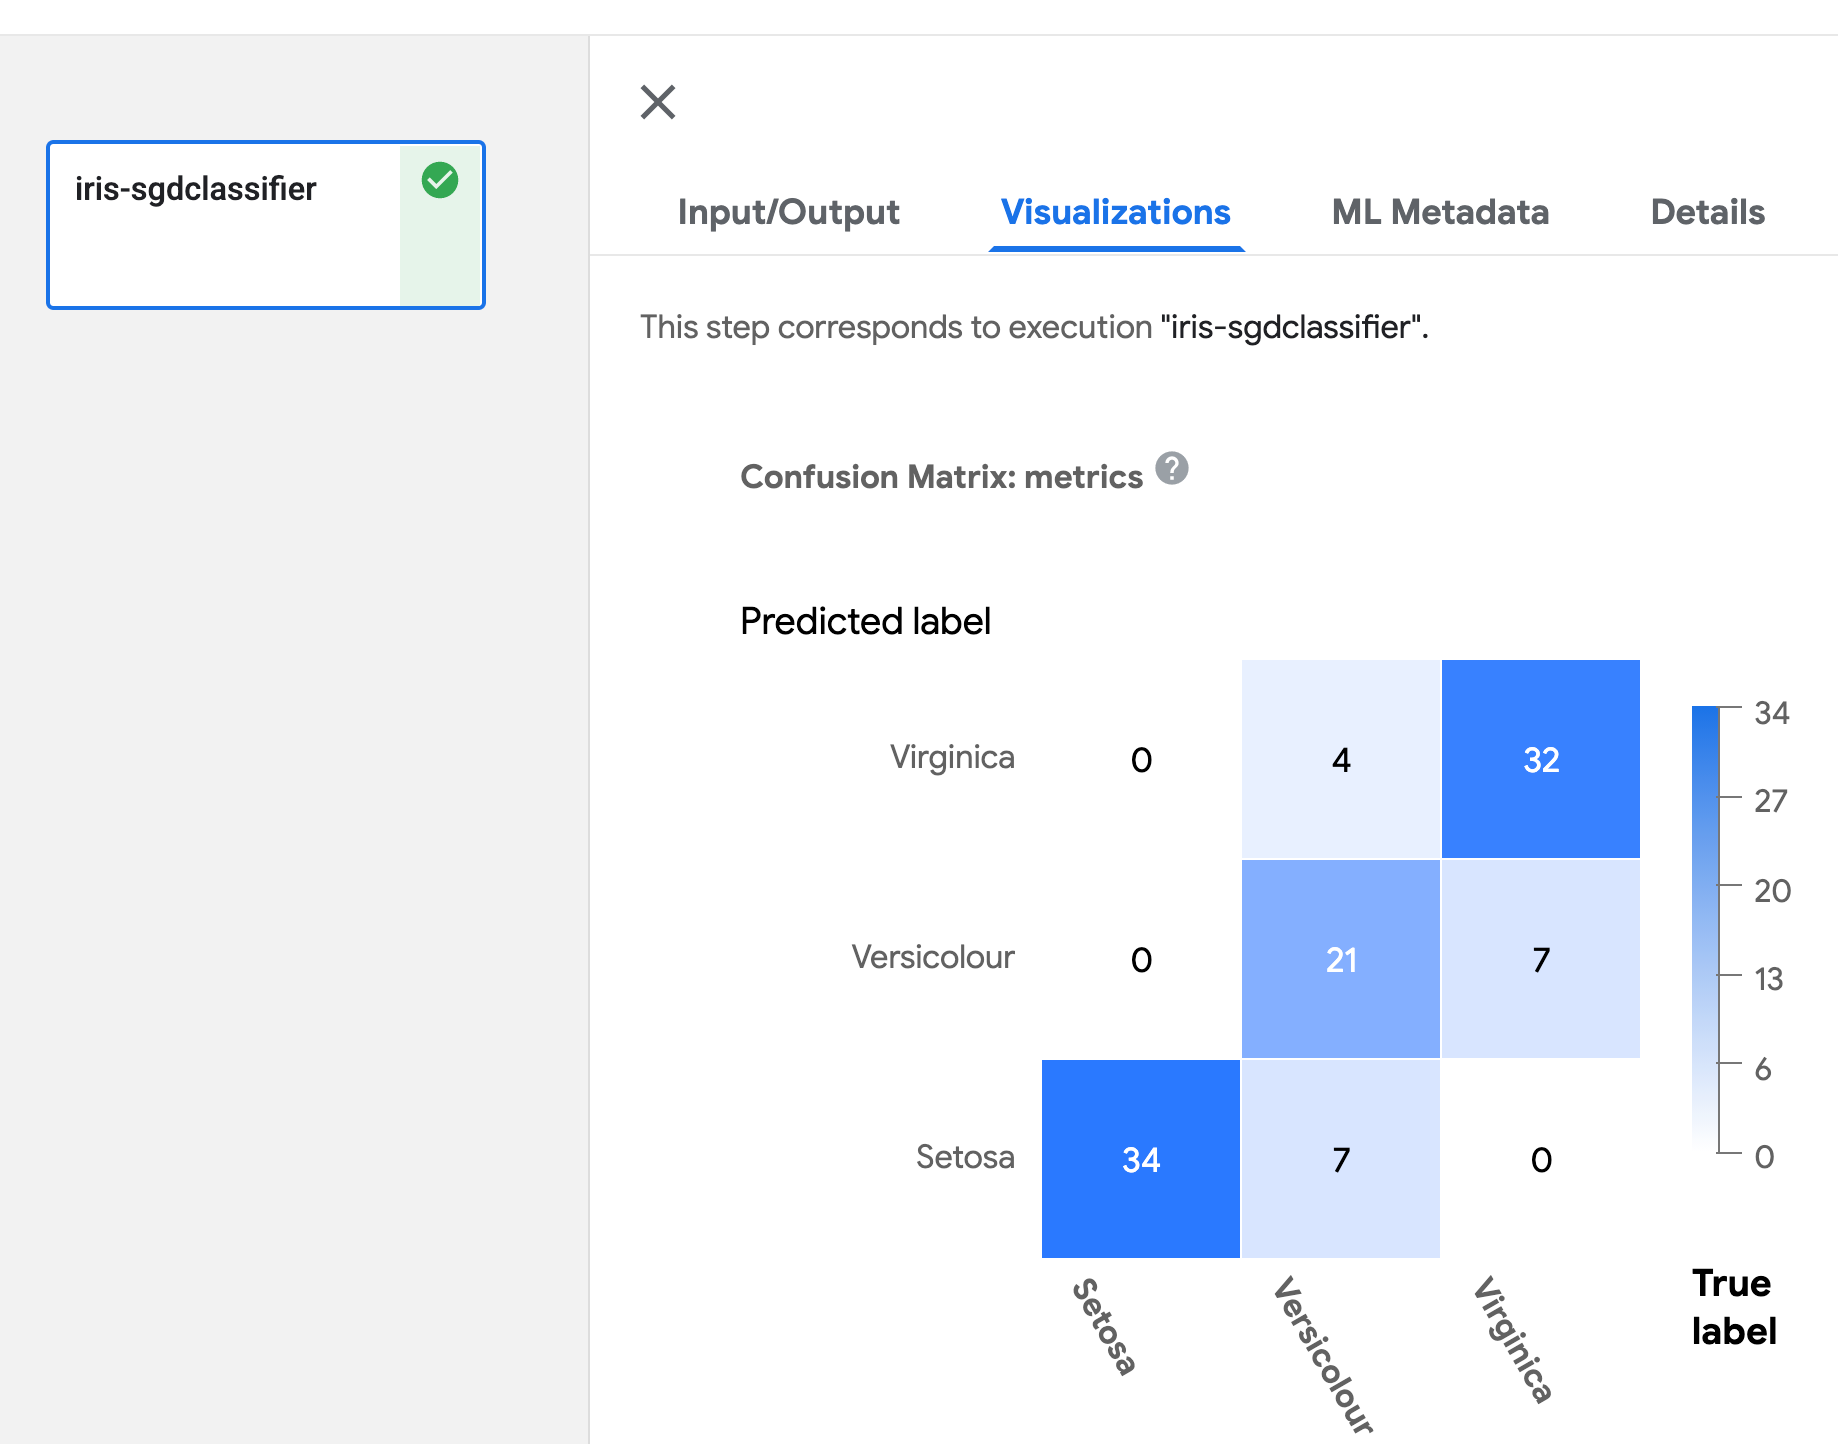
混淆矩阵
在组件函数中定义 Output[ClassificationMetrics] 参数,然后使用 API log_confusion_matrix(self, categories: List[str], matrix: List[List[int]]) 输出混淆矩阵数据。categories 提供每个标签名称的列表,matrix 提供相应标签的预测性能。有多种 API 可用于记录混淆矩阵。有关详细信息,请参阅 artifact_types.py。
请参阅下面的示例以记录混淆矩阵
@component(
    packages_to_install=['sklearn'],
    base_image='python:3.9'
)
def iris_sgdclassifier(test_samples_fraction: float, metrics: Output[ClassificationMetrics]):
    from sklearn import datasets, model_selection
    from sklearn.linear_model import SGDClassifier
    from sklearn.metrics import confusion_matrix

    iris_dataset = datasets.load_iris()
    train_x, test_x, train_y, test_y = model_selection.train_test_split(
        iris_dataset['data'], iris_dataset['target'], test_size=test_samples_fraction)


    classifier = SGDClassifier()
    classifier.fit(train_x, train_y)
    predictions = model_selection.cross_val_predict(classifier, train_x, train_y, cv=3)
    metrics.log_confusion_matrix(
        ['Setosa', 'Versicolour', 'Virginica'],
        confusion_matrix(train_y, predictions).tolist() # .tolist() to convert np array to list.
    )

@dsl.pipeline(
    name='metrics-visualization-pipeline')
def metrics_visualization_pipeline():
    iris_sgdclassifier_op = iris_sgdclassifier(test_samples_fraction=0.3)
混淆矩阵的可视化如下所示
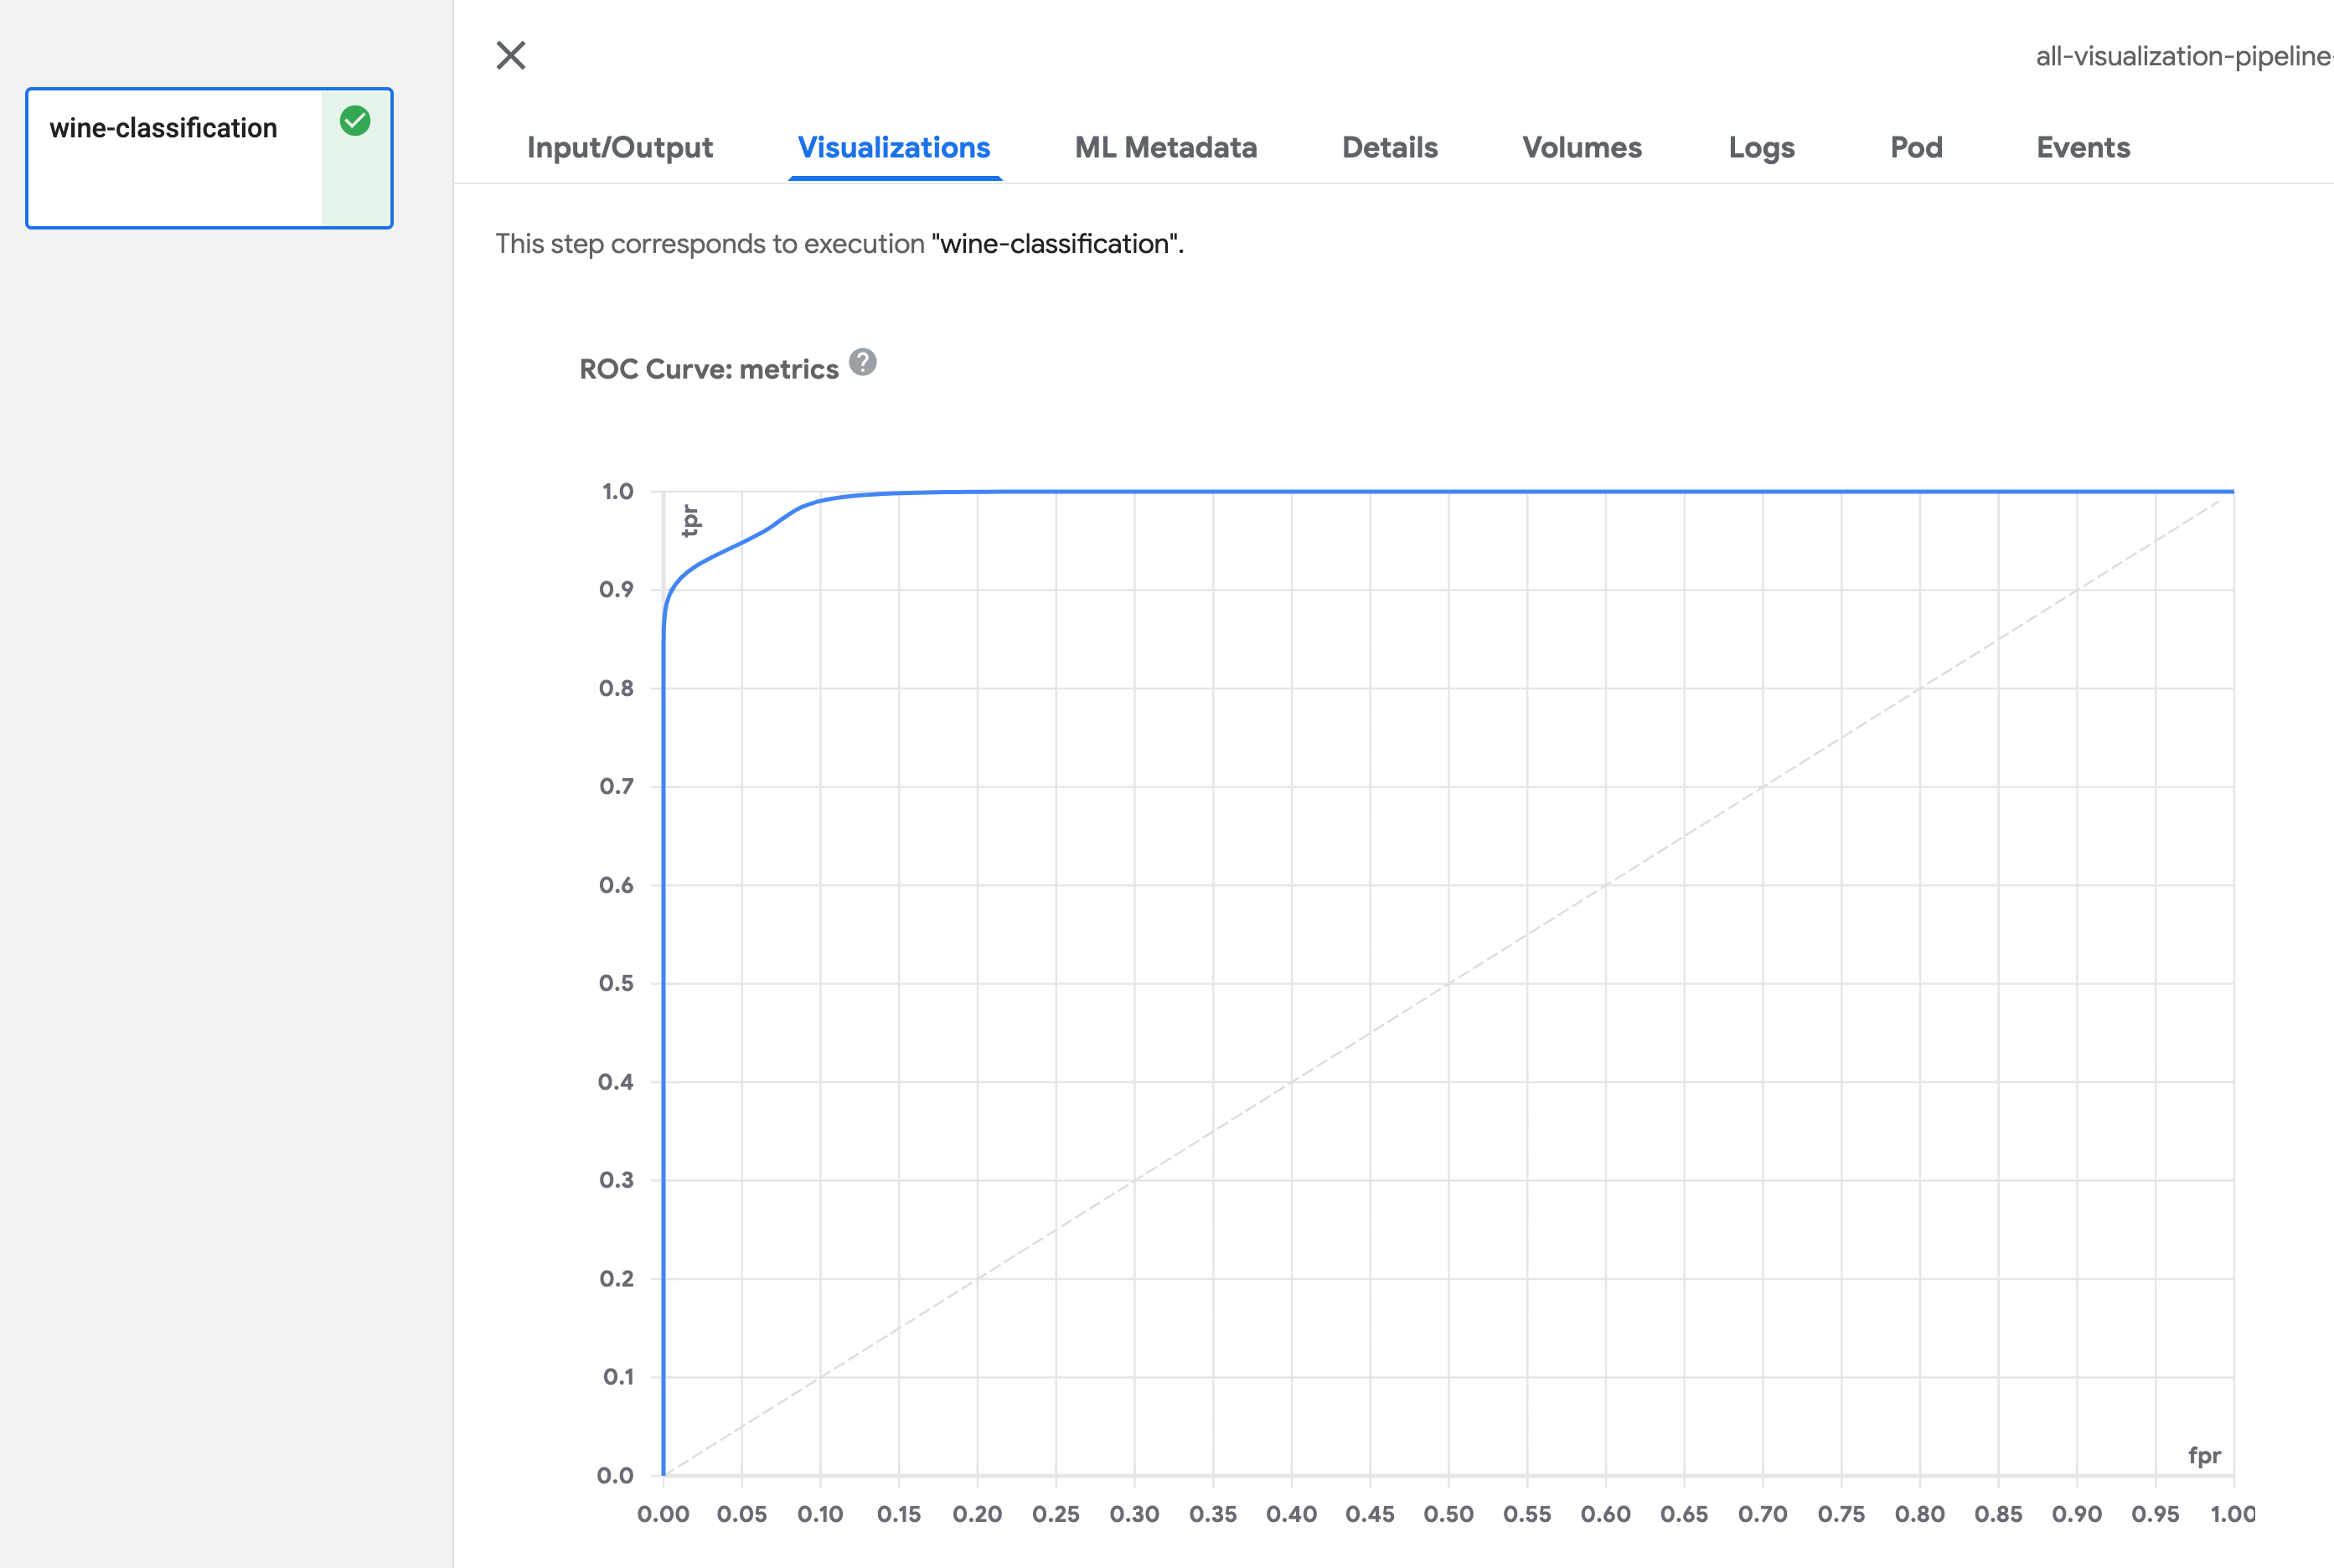
ROC 曲线
在组件函数中定义 Output[ClassificationMetrics] 参数,然后使用 API log_roc_curve(self, fpr: List[float], tpr: List[float], threshold: List[float]) 输出 ROC 曲线数据。fpr 定义假正率值的列表,tpr 定义真正率值的列表,threshold 指示此概率曲线的敏感度和特异性水平。有多种 API 可用于记录 ROC 曲线。有关详细信息,请参阅 artifact_types.py。
@component(
    packages_to_install=['sklearn'],
    base_image='python:3.9',
)
def wine_classification(metrics: Output[ClassificationMetrics]):
    from sklearn.ensemble import RandomForestClassifier
    from sklearn.metrics import roc_curve
    from sklearn.datasets import load_wine
    from sklearn.model_selection import train_test_split, cross_val_predict

    X, y = load_wine(return_X_y=True)
    # Binary classification problem for label 1.
    y = y == 1

    X_train, X_test, y_train, y_test = train_test_split(X, y, random_state=42)
    rfc = RandomForestClassifier(n_estimators=10, random_state=42)
    rfc.fit(X_train, y_train)
    y_scores = cross_val_predict(rfc, X_train, y_train, cv=3, method='predict_proba')
    y_predict = cross_val_predict(rfc, X_train, y_train, cv=3, method='predict')
    fpr, tpr, thresholds = roc_curve(y_true=y_train, y_score=y_scores[:,1], pos_label=True)
    metrics.log_roc_curve(fpr, tpr, thresholds)

@dsl.pipeline(
    name='metrics-visualization-pipeline')
def metrics_visualization_pipeline():
    wine_classification_op = wine_classification()
ROC 曲线的可视化如下所示
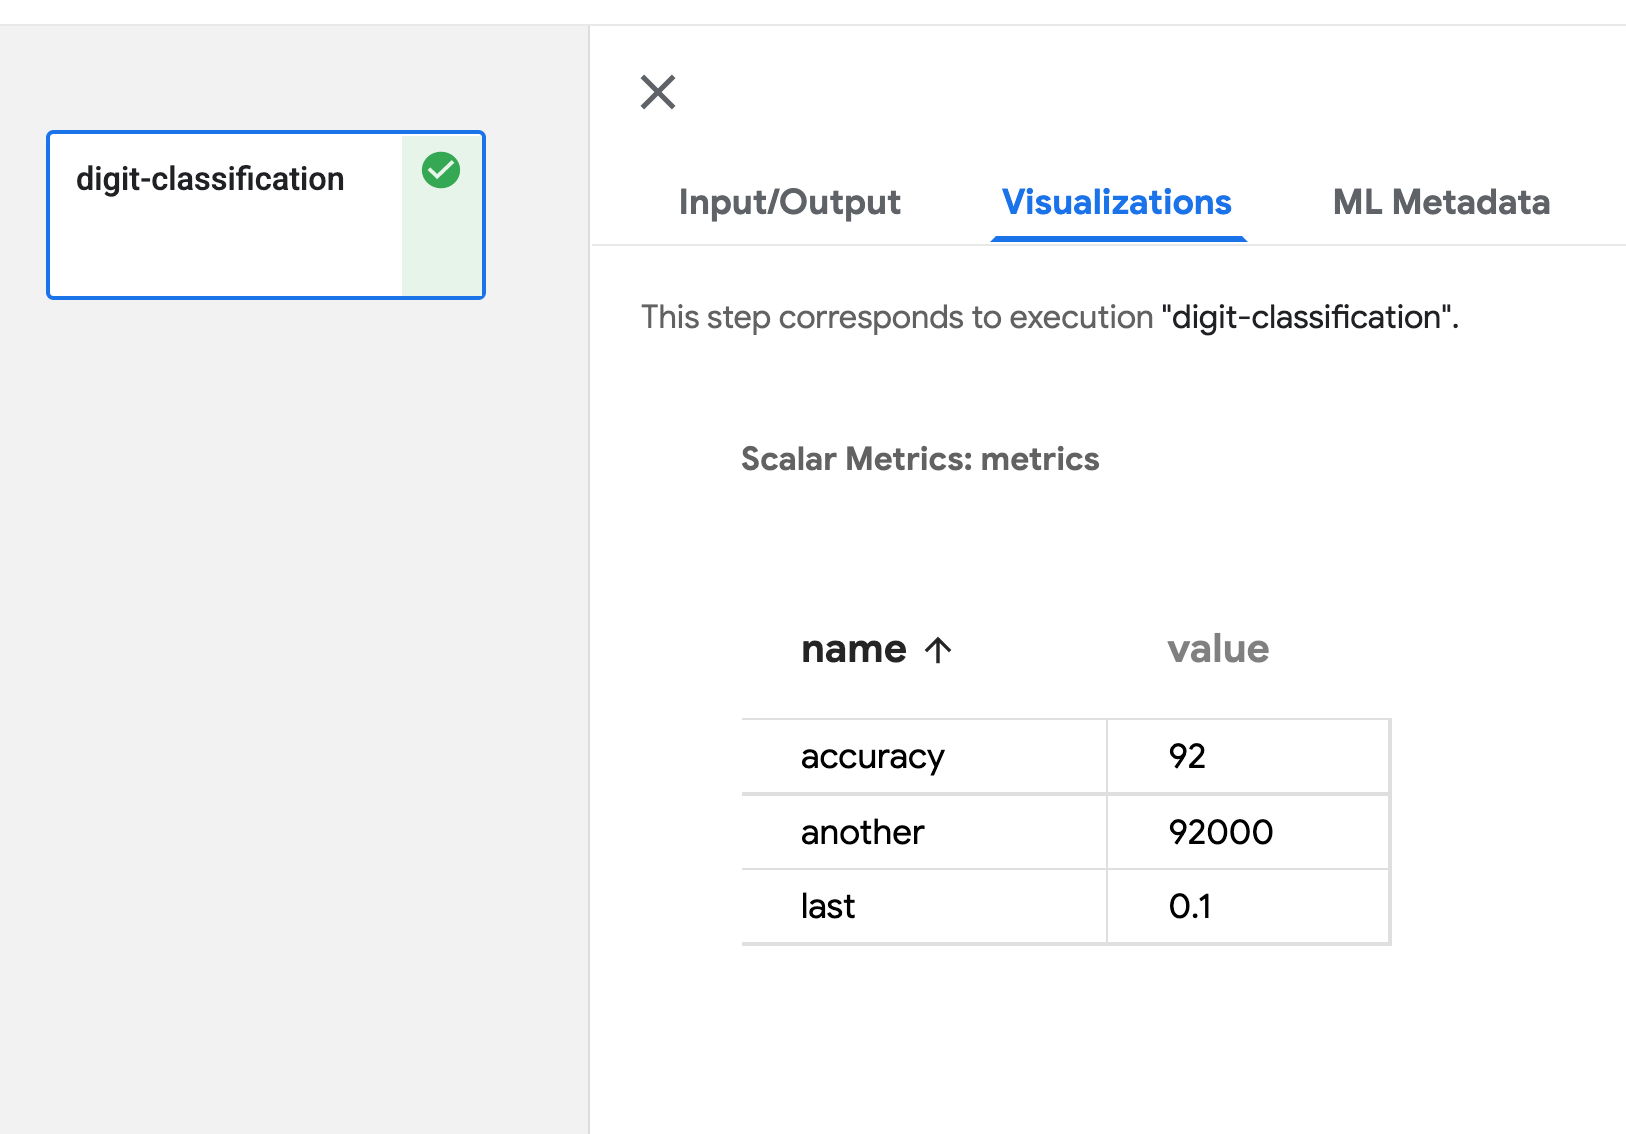
标量指标
在组件函数中定义 Output[Metrics] 参数,然后使用 API log_metric(self, metric: str, value: float) 输出标量数据。您可以通过多次调用此 API 来定义任意数量的指标。metric 定义指标名称,value 是此指标的值。有关详细信息,请参阅 artifacts_types.py。
@component(
    packages_to_install=['sklearn'],
    base_image='python:3.9',
)
def digit_classification(metrics: Output[Metrics]):
    from sklearn import model_selection
    from sklearn.linear_model import LogisticRegression
    from sklearn import datasets
    from sklearn.metrics import accuracy_score

    # Load digits dataset
    iris = datasets.load_iris()

    # # Create feature matrix
    X = iris.data

    # Create target vector
    y = iris.target

    #test size
    test_size = 0.33

    seed = 7
    #cross-validation settings
    kfold = model_selection.KFold(n_splits=10, random_state=seed, shuffle=True)

    #Model instance
    model = LogisticRegression()
    scoring = 'accuracy'
    results = model_selection.cross_val_score(model, X, y, cv=kfold, scoring=scoring)

    #split data
    X_train, X_test, y_train, y_test = model_selection.train_test_split(X, y, test_size=test_size, random_state=seed)
    #fit model
    model.fit(X_train, y_train)

    #accuracy on test set
    result = model.score(X_test, y_test)
    metrics.log_metric('accuracy', (result*100.0))

@dsl.pipeline(
    name='metrics-visualization-pipeline')
def metrics_visualization_pipeline():
    digit_classification_op = digit_classification()
标量指标的可视化如下所示
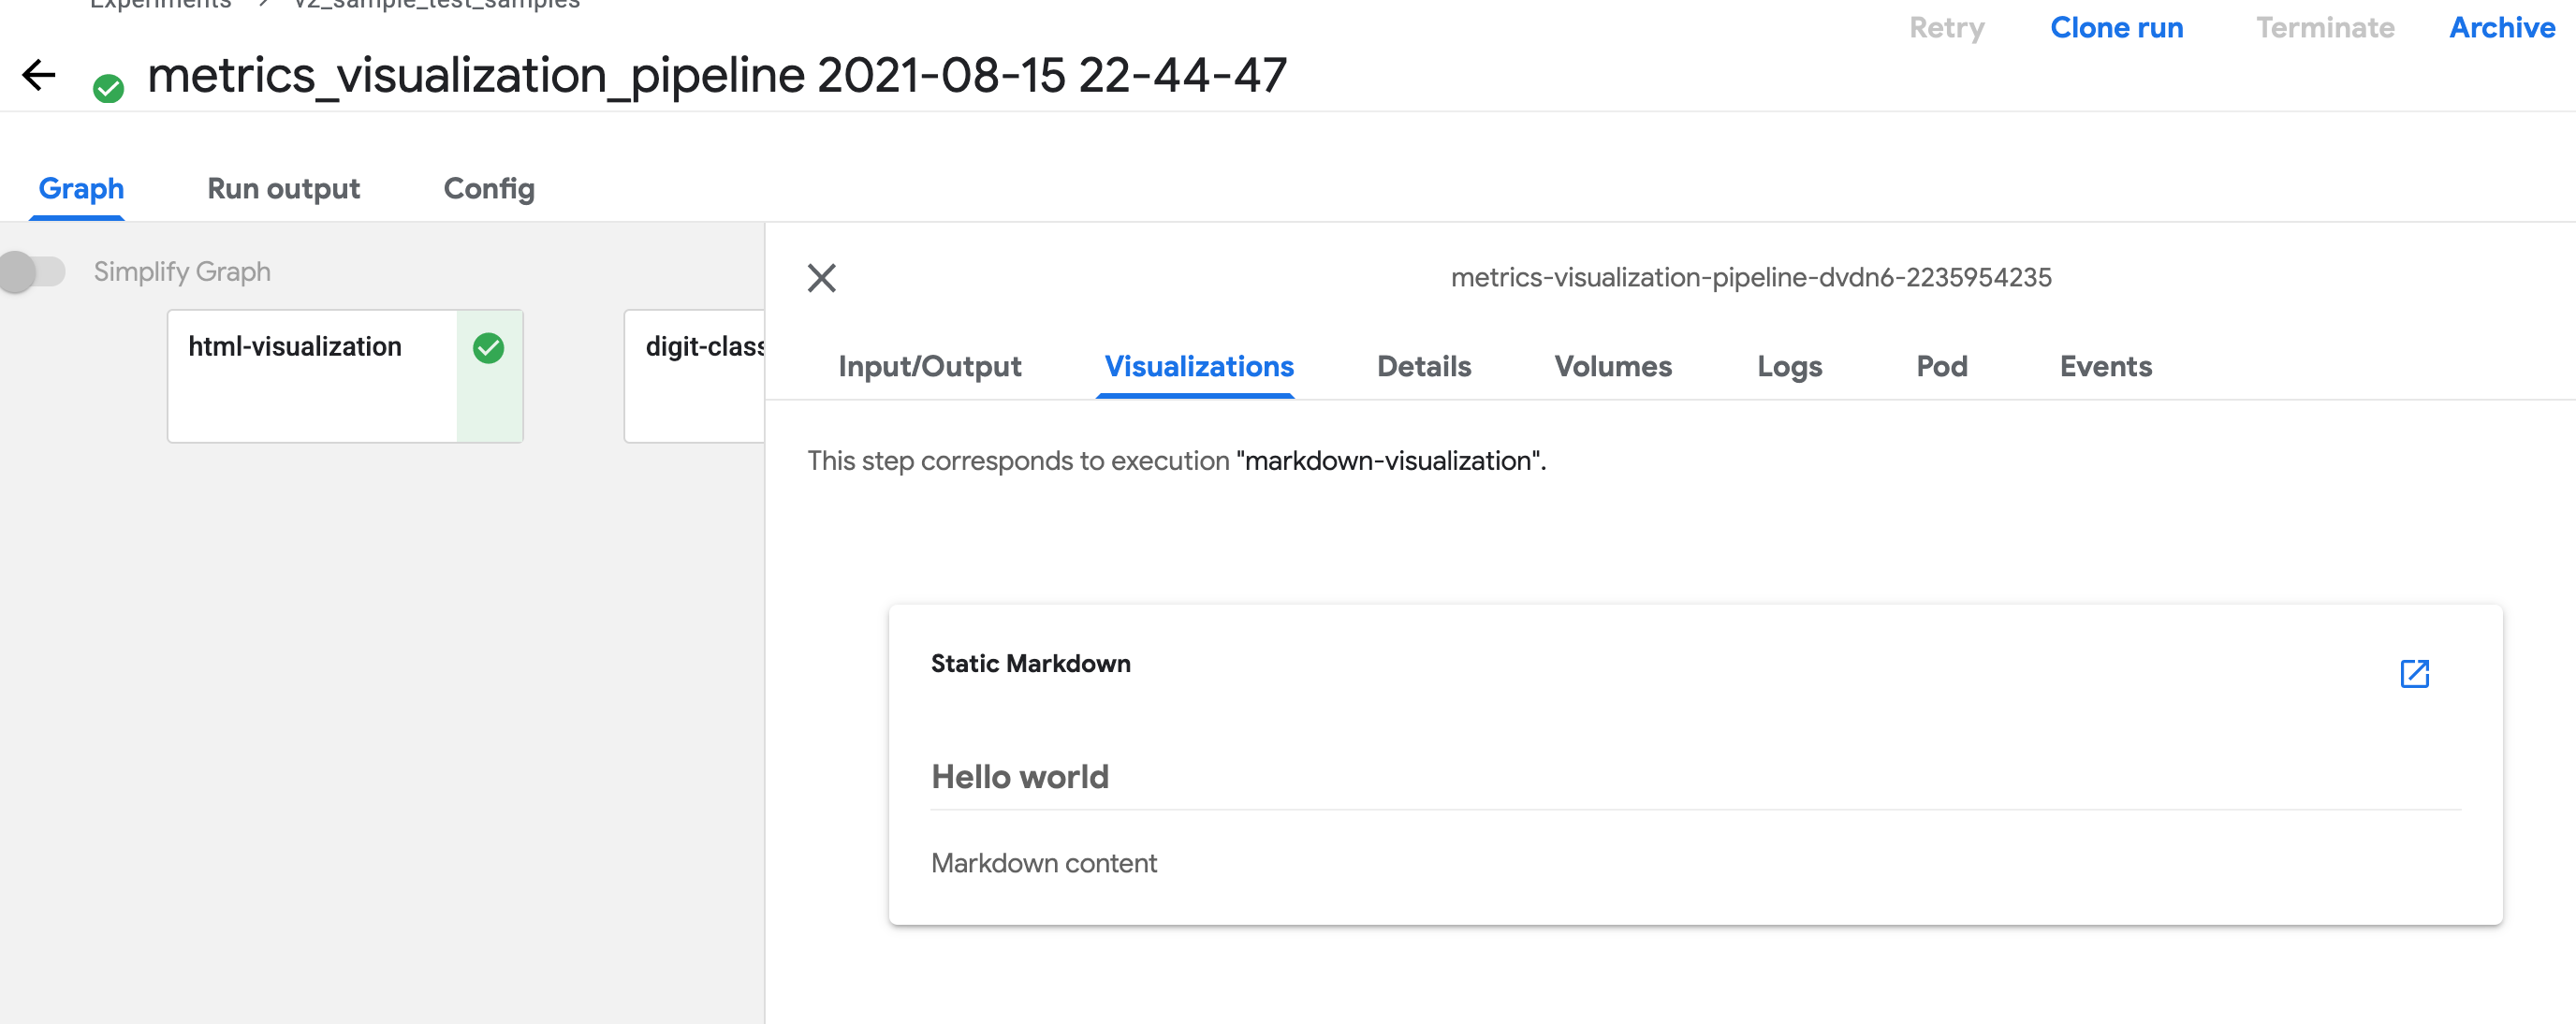
Markdown
在组件函数中定义 Output[Markdown] 参数,然后将 Markdown 文件写入路径 <artifact_argument_name>.path。有关详细信息,请参阅 artifact_types.py。
@component
def markdown_visualization(markdown_artifact: Output[Markdown]):
    markdown_content = '## Hello world \n\n Markdown content'
    with open(markdown_artifact.path, 'w') as f:
        f.write(markdown_content)
单个 HTML 文件
您可以指定组件创建的 HTML 文件,Kubeflow Pipelines UI 会在输出页面中渲染该 HTML。HTML 文件必须是独立的,不能引用文件系统中的其他文件。HTML 文件可以包含对 Web 上文件的绝对引用。在 HTML 文件内运行的内容位于 iframe 沙箱中,无法与 Kubeflow Pipelines UI 通信。
在组件函数中定义 Output[HTML] 参数,然后将 HTML 文件写入路径 <artifact_argument_name>.path。有关详细信息,请参阅 artifact_types.py。
@component
def html_visualization(html_artifact: Output[HTML]):
    html_content = '<!DOCTYPE html><html><body><h1>Hello world</h1></body></html>'
    with open(html_artifact.path, 'w') as f:
        f.write(html_content)
v2 示例来源
V2 或 V2 兼容模式下的指标可视化取决于 SDK 可视化 API,有关完整的管道示例,请参阅 metrics_visualization_v2.py。按照说明编译和运行管道,以 V2 兼容模式进行编译。
v1 SDK: 为输出查看器写入元数据
对于 KFP v1,管道组件必须写入一个 JSON 文件,指定用于可视化结果的输出查看器所需的元数据。组件还必须导出一个文件输出 artifact,其 artifact 名称为 mlpipeline-ui-metadata,否则 Kubeflow Pipelines UI 将不会渲染可视化。换句话说,生成的管道组件的 .outputs.artifacts 设置应如下所示:- {name: mlpipeline-ui-metadata, path: /mlpipeline-ui-metadata.json}。JSON 文件路径无关紧要,但为了与下面的示例保持一致,使用了 /mlpipeline-ui-metadata.json。
JSON 指定了一个 outputs 数组。每个 outputs 条目描述一个输出查看器的元数据。JSON 结构如下所示
{
  "version": 1,
  "outputs": [
    {
      "type": "confusion_matrix",
      "format": "csv",
      "source": "my-dir/my-matrix.csv",
      "schema": [
        {"name": "target", "type": "CATEGORY"},
        {"name": "predicted", "type": "CATEGORY"},
        {"name": "count", "type": "NUMBER"},
      ],
      "labels": "vocab"
    },
    {
      ...
    }
  ]
}
如果组件将其文件写入容器文件系统,Kubeflow Pipelines 系统会提取该文件,然后 Kubeflow Pipelines UI 使用该文件生成指定的查看器。元数据指定从何处加载 artifact 数据。Kubeflow Pipelines UI 会将数据加载到内存中并进行渲染。注意:您应该将这些数据保存在 UI 可管理的卷中,例如在将文件导出为 artifact 之前运行采样步骤。
下表显示了您可以在 outputs 数组中指定的可用元数据字段。每个 outputs 条目必须具有 type 字段。根据 type 的值,可能还需要页面后面输出查看器列表中描述的其他字段。
| 字段名称 | 描述 |
|---|---|
format | artifact 数据的格式。默认值为 csv。注意:目前唯一可用的格式是 csv。 |
header | 用作 artifact 数据标题的字符串列表。例如,在表格中,这些字符串用作第一行。 |
labels | 用作 artifact 列或行标签的字符串列表。 |
predicted_col | 预测列的名称。 |
schema | 指定 artifact 数据模式的 {type, name} 对象列表。 |
source | 数据的完整路径。可用位置包括 路径可以包含通配符 ‘*’,在这种情况下,Kubeflow Pipelines UI 会连接匹配源文件中的数据。 当 |
storage | (可选) 当 请注意,除了 markdown 之外,对内联可视化的支持是在 Kubeflow Pipelines 0.2.5 中引入的。在使用这些可视化之前,请将您的 Kubeflow Pipelines 集群升级到 0.2.5 或更高版本。 |
target_col | 目标列的名称。 |
type | 用于可视化数据的查看器名称。下面的列表显示了可用类型。 |
可用的输出查看器
以下部分描述了可用的查看器类型以及每种类型所需的元数据字段。
混淆矩阵
类型: confusion_matrix
所需元数据字段
formatlabelsschemasource
可选元数据字段
storage
confusion_matrix 查看器使用 schema 解析给定 source 路径中的数据,绘制混淆矩阵可视化。labels 提供要在 x 轴和 y 轴上绘制的类别名称。
指定 'storage': 'inline' 以直接将混淆矩阵 CSV 文件的原始内容作为字符串嵌入到 source 字段中。
示例
def confusion_matrix_viz(mlpipeline_ui_metadata_path: kfp.components.OutputPath()):
  import json

  metadata = {
    'outputs' : [{
      'type': 'confusion_matrix',
      'format': 'csv',
      'schema': [
        {'name': 'target', 'type': 'CATEGORY'},
        {'name': 'predicted', 'type': 'CATEGORY'},
        {'name': 'count', 'type': 'NUMBER'},
      ],
      'source': <CONFUSION_MATRIX_CSV_FILE>,
      # Convert vocab to string because for bealean values we want "True|False" to match csv data.
      'labels': list(map(str, vocab)),
    }]
  }

  with open(mlpipeline_ui_metadata_path, 'w') as metadata_file:
    json.dump(metadata, metadata_file)
Kubeflow Pipelines UI 上的可视化

Markdown
类型: markdown
所需元数据字段
source
可选元数据字段
storage
markdown 查看器在 Kubeflow Pipelines UI 上渲染 Markdown 字符串。查看器可以从以下位置读取 Markdown 数据
- 嵌入在
source字段中的 Markdown 格式字符串。storage字段的值必须为inline。 - 远程文件中的 Markdown 代码,位于
source字段中指定的路径。storage字段可以为空或包含除inline之外的任何值。
示例
def markdown_vis(mlpipeline_ui_metadata_path: kfp.components.OutputPath()):
  import json

  metadata = {
    'outputs' : [
    # Markdown that is hardcoded inline
    {
      'storage': 'inline',
      'source': '# Inline Markdown\n[A link](https://kubeflow.org.cn/)',
      'type': 'markdown',
    },
    # Markdown that is read from a file
    {
      'source': 'gs://your_project/your_bucket/your_markdown_file',
      'type': 'markdown',
    }]
  }

  with open(mlpipeline_ui_metadata_path, 'w') as metadata_file:
    json.dump(metadata, metadata_file)
Kubeflow Pipelines UI 上的可视化

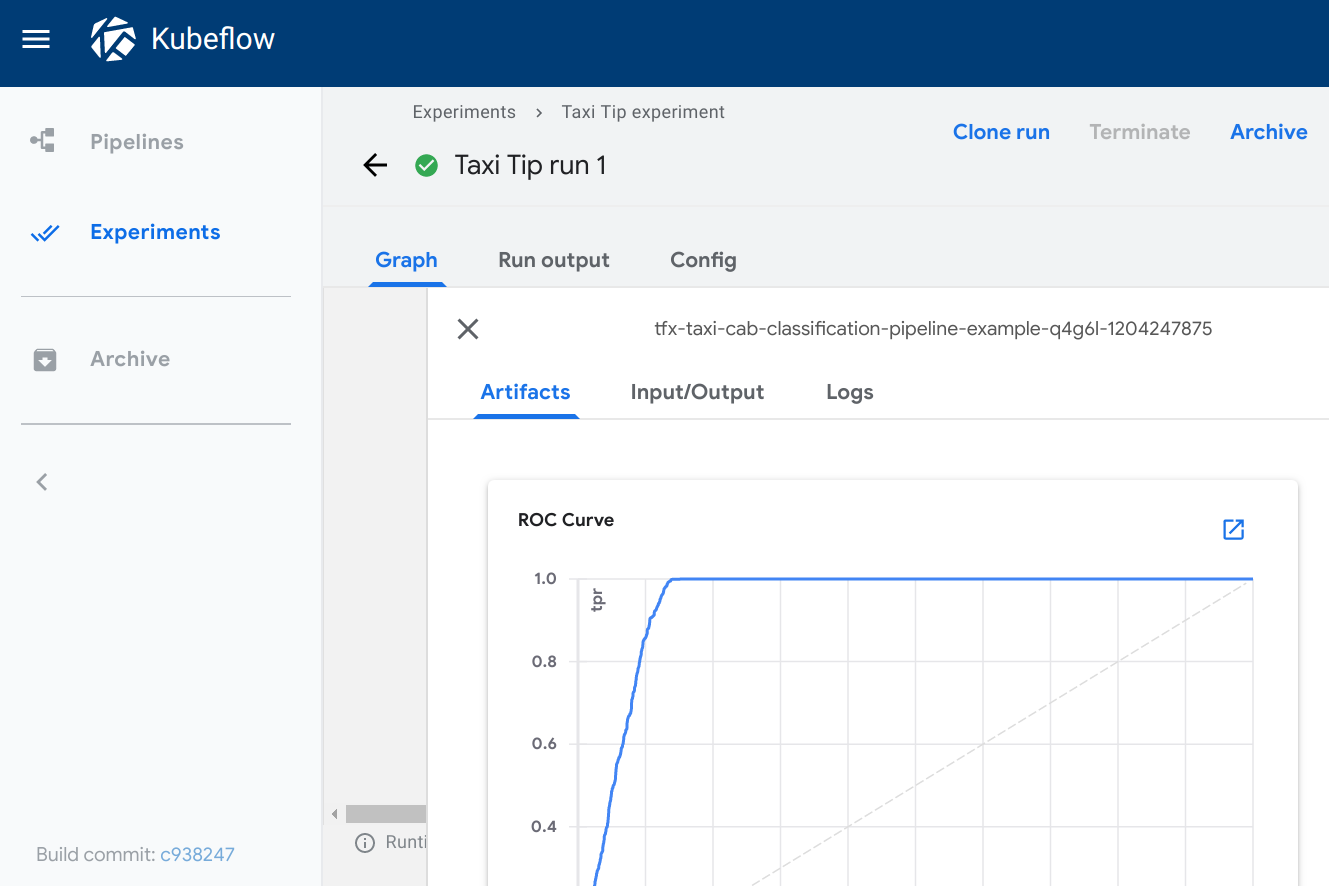
ROC 曲线
类型: roc
所需元数据字段
formatschemasource
roc 查看器使用给定源路径中的数据绘制接收者操作特征 (ROC) 曲线。Kubeflow Pipelines UI 假定模式包含以下三个名称的列
fpr(假正率)tpr(真正率)阈值
可选元数据字段
storage
查看 ROC 曲线时,将鼠标悬停在 ROC 曲线上,可以查看用于光标最接近的 fpr 和 tpr 值的阈值。
指定 'storage': 'inline' 以直接将 ROC 曲线 CSV 文件的原始内容作为字符串嵌入到 source 字段中。
示例
def roc_vis(roc_csv_file_path: str, mlpipeline_ui_metadata_path: kfp.components.OutputPath()):
  import json

  df_roc = pd.DataFrame({'fpr': fpr, 'tpr': tpr, 'thresholds': thresholds})
  roc_file = os.path.join(roc_csv_file_path, 'roc.csv')
  with file_io.FileIO(roc_file, 'w') as f:
    df_roc.to_csv(f, columns=['fpr', 'tpr', 'thresholds'], header=False, index=False)

  metadata = {
    'outputs': [{
      'type': 'roc',
      'format': 'csv',
      'schema': [
        {'name': 'fpr', 'type': 'NUMBER'},
        {'name': 'tpr', 'type': 'NUMBER'},
        {'name': 'thresholds', 'type': 'NUMBER'},
      ],
      'source': roc_file
    }]
  }

  with open(mlpipeline_ui_metadata_path, 'w') as metadata_file:
    json.dump(metadata, metadata_file)
Kubeflow Pipelines UI 上的可视化
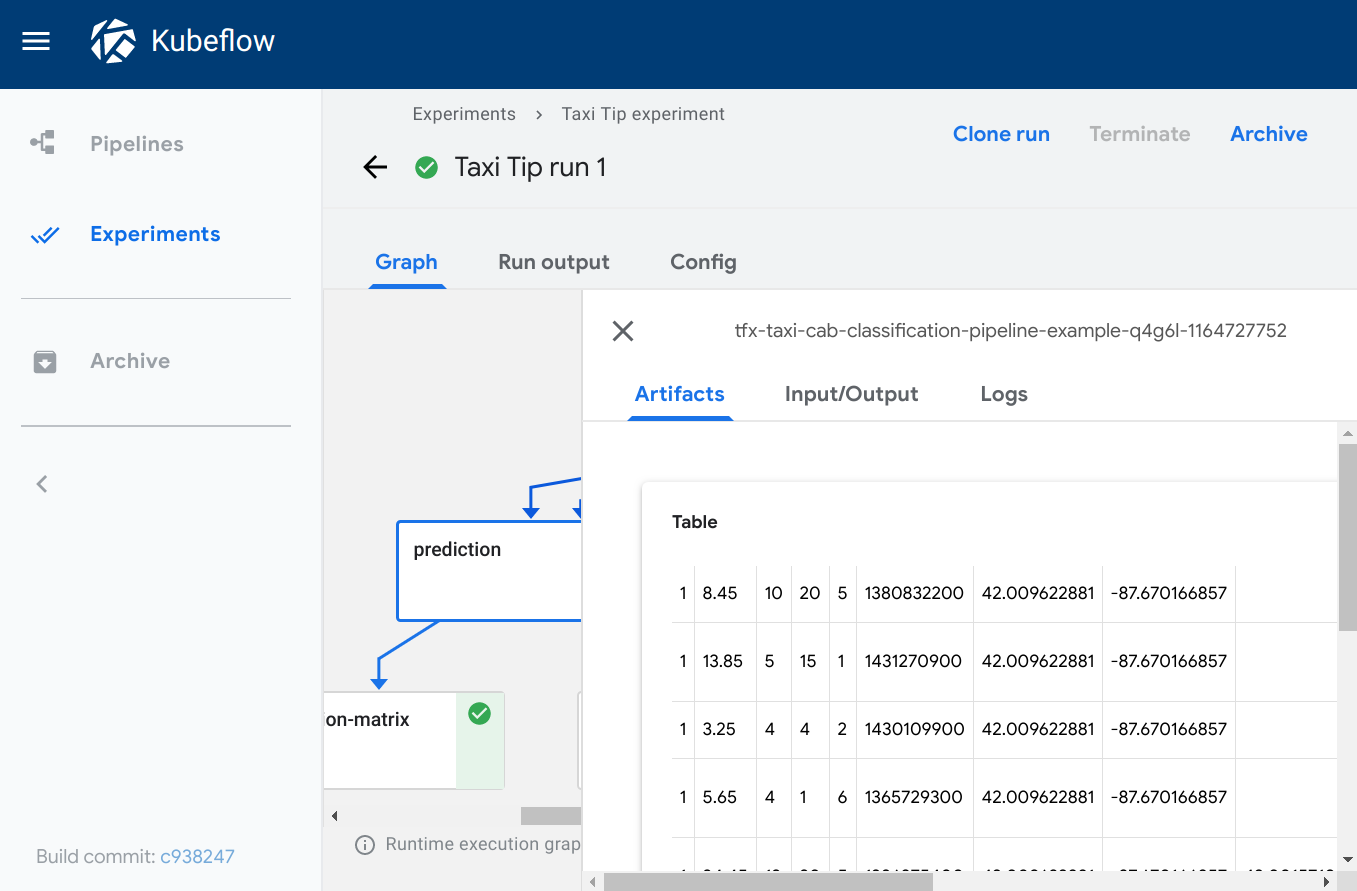
表格
类型: table
所需元数据字段
formatheadersource
可选元数据字段
storage
table 查看器根据给定 source 路径中的数据构建 HTML 表格,其中 header 字段指定表格第一行显示的值。该表格支持分页。
指定 'storage': 'inline' 以直接将 CSV 表格内容字符串嵌入到 source 字段中。
示例
def table_vis(mlpipeline_ui_metadata_path: kfp.components.OutputPath()):
  import json

  metadata = {
    'outputs' : [{
      'type': 'table',
      'storage': 'gcs',
      'format': 'csv',
      'header': [x['name'] for x in schema],
      'source': prediction_results
    }]
  }

  with open(mlpipeline_ui_metadata_path, 'w') as metadata_file:
    json.dump(metadata, metadata_file)
Kubeflow Pipelines UI 上的可视化
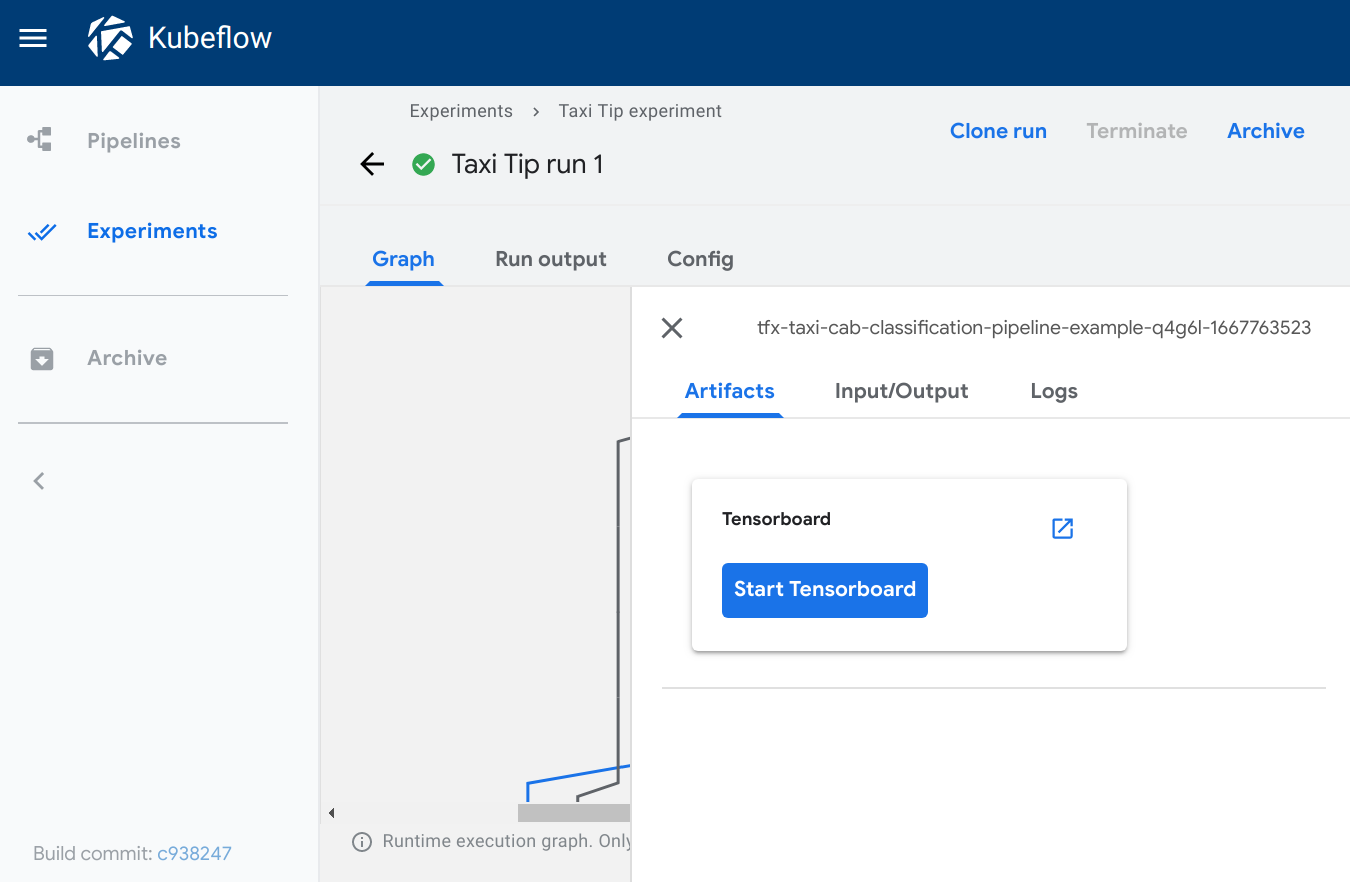
TensorBoard
类型: tensorboard
所需元数据字段
source
tensorboard 查看器会在输出页面添加一个启动 Tensorboard 按钮。
查看输出页面时,您可以
- 点击启动 Tensorboard 在 Kubeflow 集群中启动一个 TensorBoard Pod。按钮文本会切换为打开 Tensorboard。
- 点击打开 Tensorboard 在新选项卡中打开 TensorBoard 界面,指向
source字段中指定的 logdir 数据。 - 点击删除 Tensorboard 关闭 Tensorboard 实例。
注意: Kubeflow Pipelines UI 并不能完全管理您的 TensorBoard 实例。“启动 Tensorboard”按钮是为了方便您在查看管道运行时无需中断工作流程。您需要负责使用 Kubernetes 管理工具回收或删除 TensorBoard Pod。
示例
def tensorboard_vis(mlpipeline_ui_metadata_path: kfp.components.OutputPath()):
  import json

  metadata = {
    'outputs' : [{
      'type': 'tensorboard',
      'source': args.job_dir,
    }]
  }

  with open(mlpipeline_ui_metadata_path, 'w') as metadata_file:
    json.dump(metadata, metadata_file)
Kubeflow Pipelines UI 上的可视化
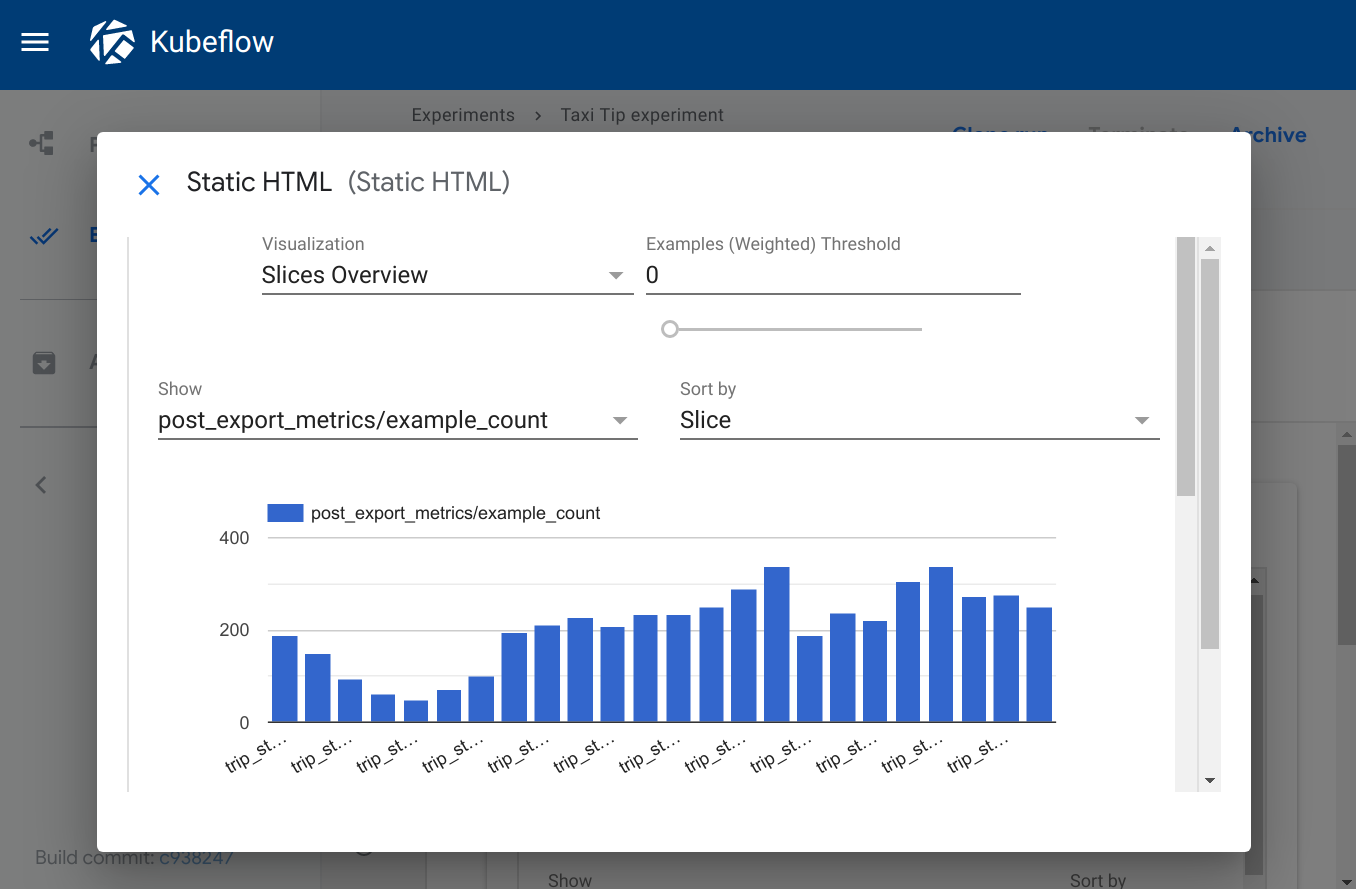
Web 应用
类型: web-app
所需元数据字段
source
可选元数据字段
storage
web-app 查看器提供了渲染自定义输出的灵活性。您可以指定组件创建的 HTML 文件,Kubeflow Pipelines UI 会在输出页面中渲染该 HTML。HTML 文件必须是独立的,不能引用文件系统中的其他文件。HTML 文件可以包含对 Web 上文件的绝对引用。在 web 应用内运行的内容位于 iframe 沙箱中,无法与 Kubeflow Pipelines UI 通信。
指定 'storage': 'inline' 以直接将原始 html 嵌入到 source 字段中。
示例
def tensorboard_vis(mlpipeline_ui_metadata_path: kfp.components.OutputPath()):
  import json

  static_html_path = os.path.join(output_dir, _OUTPUT_HTML_FILE)
  file_io.write_string_to_file(static_html_path, rendered_template)

  metadata = {
    'outputs' : [{
      'type': 'web-app',
      'storage': 'gcs',
      'source': static_html_path,
    }, {
      'type': 'web-app',
      'storage': 'inline',
      'source': '<h1>Hello, World!</h1>',
    }]
  }

  with open(mlpipeline_ui_metadata_path, 'w') as metadata_file:
    json.dump(metadata, metadata_file)
Kubeflow Pipelines UI 上的可视化
v1 示例来源
v1 示例来自部署 Kubeflow 时预安装的税收小费预测示例。
您可以通过在 Kubeflow Pipelines UI 中选择[示例] ML - TFX - 出租车小费预测模型训练器来运行该示例。有关 UI 入门的帮助,请参阅 Kubeflow Pipelines 快速入门。
管道使用了一些预构建的可重用组件,包括
- 混淆矩阵组件,它为
confusion_matrix查看器写入数据。 - ROC 组件,它为
roc查看器写入数据。 - dnntrainer 组件,它为
tensorboard查看器写入数据。 - tfma 组件,它为
web-app查看器写入数据。
轻量级 Python 组件 Notebook 示例
有关轻量级 Python 组件的完整示例,请参阅轻量级 Python 组件 Notebook 示例,了解有关声明输出可视化的更多信息。
YAML 组件示例
您还可以在 component.yaml 文件中配置可视化。请参阅 创建 Tensorboard 可视化组件中的 {name: MLPipeline UI Metadata} 输出。